Visualize Profitability
Built-in charts and summaries show income vs. expenses so you can see where your money’s going.


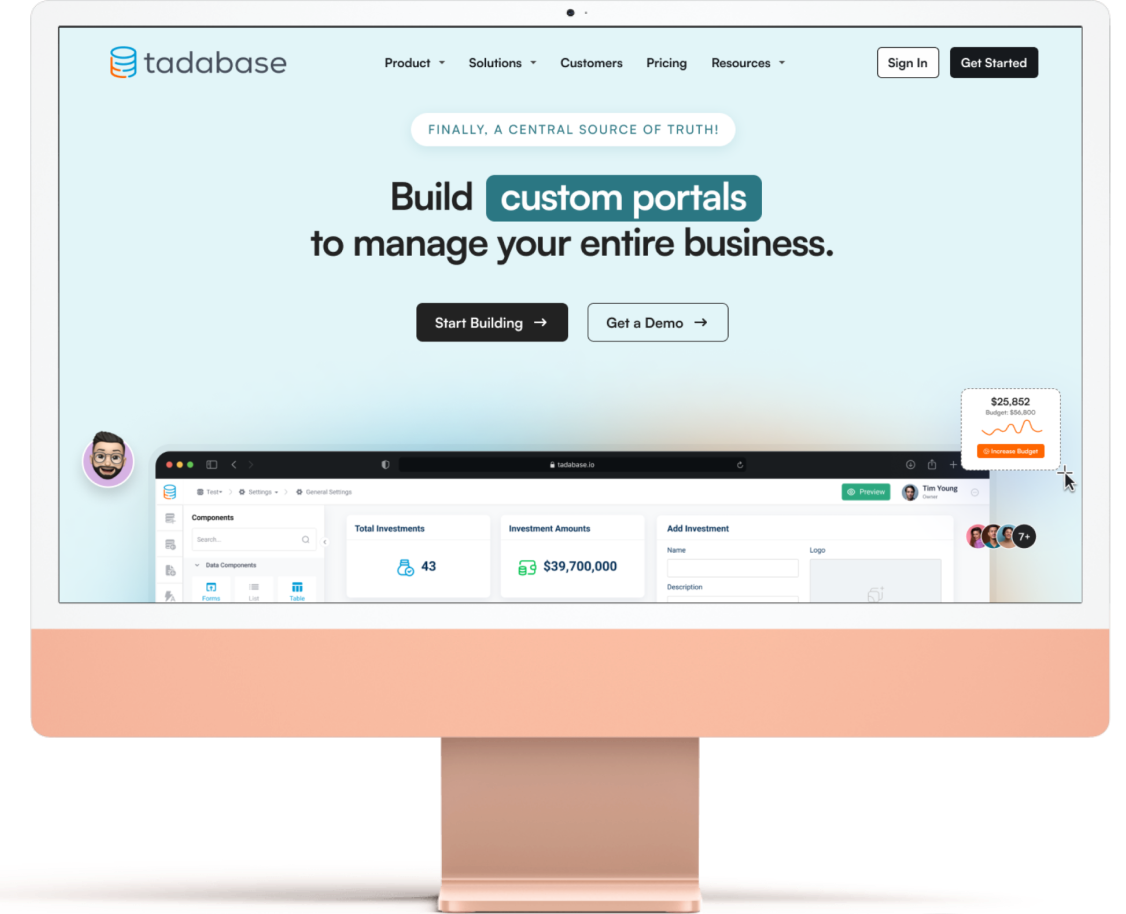
No Code Required

Manage healthcare with no-code tools that meet compliance needs.
Learn More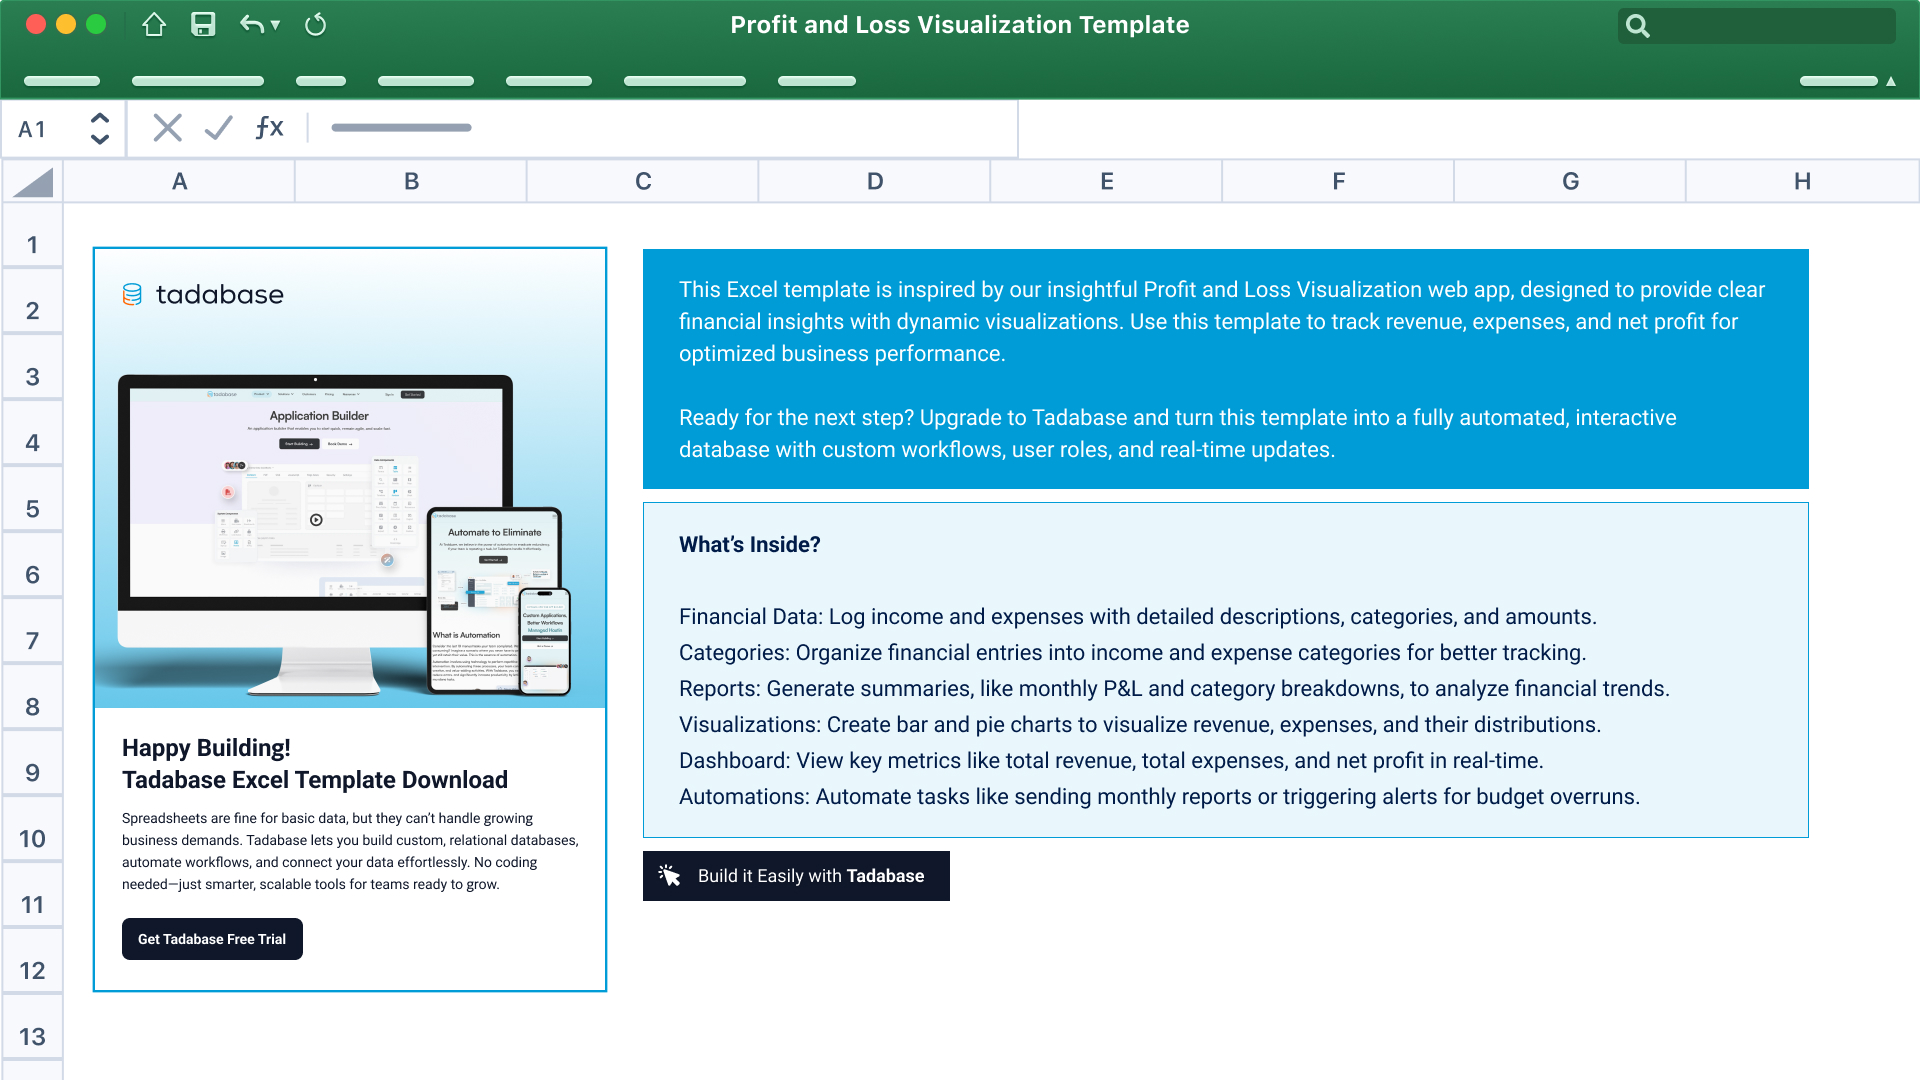
Download the free Profit and Loss Template app to view dynamic reports, monitor trends, and gain real-time insights into your business finances.

Built-in charts and summaries show income vs. expenses so you can see where your money’s going.

Compare revenue, costs, and net profit across different time periods.

Use predefined or custom categories for accurate financial reporting.

Great for founders, freelancers, and small teams needing quick P&L overviews.

Get a real-time view of income, expenses, and net profit.
Break down performance by department, service, or category.
Compare performance by month, quarter, or year.
Slice data by revenue streams, product lines, or cost centers.
Create sharable P&L summaries for investors, teams, or accounting.
Use financial data to identify trends and drive smarter spending and growth.